


Imagine you’re at a high-stakes football game, where each team represents a different business in your industry. Some teams dominate the field, scoring touchdowns effortlessly, while others struggle to gain yardage.
Now, imagine having a playbook that highlights the strengths, weaknesses, and strategies of the leading teams and provides insights on improving your gameplay. This is the power of benchmarking in digital marketing.
By comparing your performance metrics with those of leading competitors in the kitchen and bath industry, you can identify key areas for improvement and discover winning strategies to improve your marketing performance.
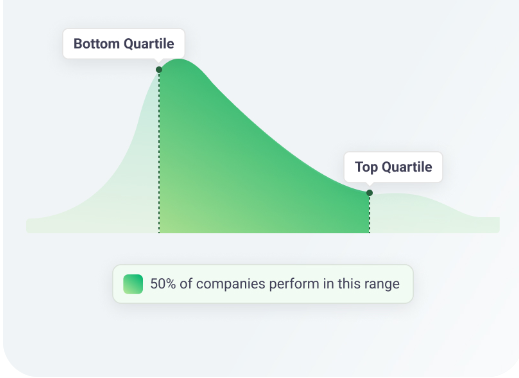
Let’s explore the exciting potential that benchmarking can unlock for your digital marketing efforts.
What are Digital Marketing Benchmarks?
Digital marketing benchmarks are standard metrics used to measure the performance of digital marketing efforts against industry standards or leading competitors. They provide a point of reference that helps you evaluate the effectiveness of your marketing strategies and identify areas for improvement.
A good example of digital marketing benchmarks is a stone fabrication company that wants to increase its online sales. They start by gathering industry conversion rate benchmarks, which indicate that the average conversion rate is 2.5%, based on data from leading fabricators.
The company then measures its current conversion rate, which is 1.8%. They realize they’re underperforming and implement A/B testing for their landing pages, optimize the checkout process, and improve product descriptions. After these changes, their conversion rate rises to 2.6%, surpassing the industry benchmark and resulting in a significant increase in sales.
The scenario above takes into account the four main steps of digital marketing benchmarks;
- The stone fabricator benchmarked its conversions against leading brands in the industry
- They realized they were underperforming and needed to improve marketing efforts
- They made relevant changes to their strategy
- They saw the results they were looking for.
Benchmarking helps you set the pace for specific marketing efforts. It shows you what you should be focusing on.
Crucial Kitchen and Bath Marketing Metrics to Benchmark
Benchmarking marketing metrics for your countertop shop or stone fabrication company is crucial for understanding performance and identifying areas for improvement. Here are some key metrics to benchmark:
1. Conversion Rate
This refers to the percentage of visitors who complete a desired action, such as purchasing or filling out a form. The conversation rate helps you assess the effectiveness of your marketing efforts in driving desired actions.
Example: If the industry average conversion rate is 2.5%, and your conversion rate is 1.8%, there’s room for improvement.
2. Click-Through Rate (CTR)
CTR is the percentage of people who click on a link, such as an ad or an email, out of the total number of people who view it. It indicates the effectiveness of ad creatives, email campaigns, and other marketing content.
Example: If the industry average CTR for email campaigns is 3%, and your email CTR is 2%, you need to improve your subject lines or call-to-action.
3. Bounce Rate
This is the percentage of visitors who leave the site after viewing only one page. High bounce rates can indicate that the landing page content isn’t engaging or relevant.
Example: An industry average bounce rate might be 40%. If your site’s bounce rate is 55%, you may need to improve page load speed or content relevance.
4. Cost Per Click (CPC)
The price paid by an advertiser for each click on their online advertisement. It is a key metric used to gauge the cost-effectiveness and performance of online ad campaigns.
Example: If the industry average CPC is $1.20, but you’re spending $2.00 per click, it indicates that your ads might need optimization to reduce costs.
5. Customer Acquisition Cost (CAC)
This is the total cost of acquiring a new customer, including marketing and sales expenses. CAC is critical for understanding the return on investment of marketing efforts.
Example: If the industry average CAC is $100, and your CAC is $150, you need to find more cost-effective ways to acquire customers.
6. Return on Investment (ROI)
Return on Investment (ROI) is a performance measure used to evaluate the efficiency or profitability of an investment. It calculates the amount of return on an investment relative to the investment’s cost. ROI is a widely used metric in digital marketing and business to assess the success of campaigns and strategies.
7. Organic Search Traffic and Sessions
This is the number of visitors coming to your site from search engine results. Your organic search traffic reflects the effectiveness of your SEO efforts.
Example: If the industry average for organic search traffic is 60% of total traffic, and your site receives 40%, there is significant potential to improve SEO.
8. Engagement Rate
Engagement rate is a crucial metric in digital marketing, representing the level of interaction that content receives from its audience. It is calculated as the percentage of engaged sessions out of total sessions, where an engaged session is defined as one in which a user stays on a page for at least 10 seconds, views more than one page, or triggers a conversion event.
For example, according to Google Analytics 4, if you have 1,000 sessions on your website and 300 of those sessions involve users staying for more than 10 seconds, viewing more than one page, or completing a conversion, your engagement rate would be 30%.
9. Email Open Rate
This is the percentage of recipients who open an email. It measures the effectiveness of email subject lines and sender reputation.
Example: If the industry average open rate is 20%, and your open rate is 15%, you might need to improve your subject lines or sender name.
Benchmarking these digital marketing metrics is crucial for countertop shops aiming to enhance their performance and achieve sustained growth.
Understanding Kitchen and Bath Marketing Benchmarking Results
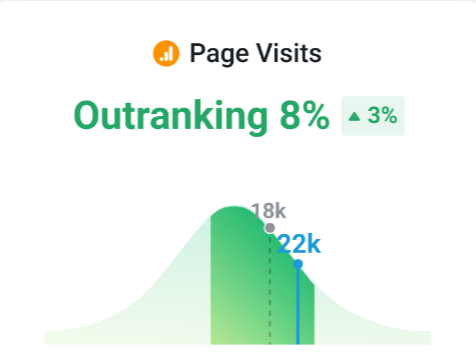
The image above offers insights into how a particular website is performing in terms of page visits compared to other businesses in the same industry and category. The comprehensive breakdown will help you understand how to read benchmarking results:
Page Visits Benchmarking
- Outranking 8%: This metric indicates that the website is performing better than 8% of its competitors in terms of page visits.
- Increase of 3%: The green arrow and the accompanying percentage indicate a recent improvement. The website’s page visits have increased by 3% compared to the previous measurement period.
Contextual Data
- Page Visits Distribution: The bell curve graph shows the distribution of page visits across different companies within your industry.
- 18k: This is the average number of page visits among the benchmarked companies.
- 22k: This is the page visits count for the website you’re comparing with the rest, indicating that it falls slightly above the average.
- Green Area: The shaded green area represents the range of performance of all the companies, with the darker green indicating the page visits of the companies you selected to use as benchmarks.
- Room for Improvement: While the website is doing better than the benchmark average, there’s still room for improvement and a lot of green space to cover.
The darker green area indicates that you’re still behind some of the companies you selected for your benchmark while the lighter green area to the right shows you more companies (overperformers) that are doing far better than you and the other companies in your benchmark (darker green area).
While the initial goal might be to exceed the benchmark, your business goal would be to continually grow and compete with the overperformers.
So, what can you do to increase your page visits?
Recommendations
- Content Optimization: Enhance the quality and relevance of website content to better engage visitors and improve page visits.
- SEO Improvements: Invest in SEO strategies to improve search engine rankings and attract more organic traffic.
- Competitor Analysis: Perform a thorough analysis of competitors who are ranking higher to identify and replicate successful strategies. Study the overperformers too.
- Marketing Campaigns: Increase efforts in digital marketing campaigns, including social media marketing, email marketing, and paid advertising, to boost visibility and traffic.
By continuously monitoring these benchmarks and implementing strategic improvements, you can aim to move up the ranking and outperform a larger percentage of your peers.
Want to See How You Perform Against Leading Fabricators in the Kitchen and Bath Industry?
At Milia Marketing, we’ve created a benchmarking group on Databox that allows you to easily see how you’re performing against top competitors and leading brands in your industry. Some of the metrics you’ll be able to track in our benchmarking group include:
- Conversions: Measure the success of your campaigns in turning visitors into customers.
- Click-Through Rate (CTR): Understand the effectiveness of your ads and content in driving traffic.
- Amount Spent: Keep track of your marketing expenses and optimize your budget.
- Average Cost Per Click (CPC): Monitor the cost-efficiency of your paid campaigns.
- Form Submissions: Gauge the interest and engagement of your audience by tracking lead generation forms.
- Bounce Rate: Assess the quality of your website traffic and identify areas for improvement.
And many more.
Join our benchmarking group and let’s explore how we can help you stay ahead of the competition, optimize your marketing efforts, and achieve your business goals. Together, we can turn data into actionable insights for your continued success.
Making the Most of Benchmarking Insights in the Stone Fabrication Industry
Benchmarking offers a wealth of insights that can transform your digital marketing strategies and geer you toward becoming a leading brand in the stone fabrication industry. To maximize the numerous benefits, you can leverage these actionable ideas for success:
- Dive Deep into the Data: Start by thoroughly analyzing the benchmark data. Look for patterns and trends that highlight areas where your performance lags behind leading stone fabricators. Pay attention to metrics like conversion rates, click-through rates, and customer engagement.
- Set SMART Goals: Use the insights from benchmarking to set Specific, Measurable, Attainable, Relevant, and Time-bound (SMART) goals. These objectives will provide a clear direction for your marketing efforts and help you track progress effectively.
- Develop a Comprehensive Action Plan: Based on the identified gaps, create detailed action plans. This might involve enhancing your SEO strategy, optimizing your content for better engagement, or refining your social media campaigns. Each action plan should outline specific steps, responsible team members, and deadlines.
- Adopt Best Practices: Learn from the best practices of industry leaders. Study their strategies and tactics, and adapt them to fit your business. This could include improving your website’s user experience, leveraging advanced analytics tools, or implementing effective email marketing campaigns.
- Monitor and Adjust: Regularly track your performance against the benchmarks to ensure you are making progress. Use tools like Google Analytics, social media insights, and CRM systems to monitor key metrics. Be prepared to adjust your strategies based on what the data reveals.
- Foster a Culture of Continuous Improvement: Encourage your team to embrace a mindset of ongoing learning and improvement. Benchmarking should be an ongoing process, not a one-time activity. Regularly revisit and update your benchmarks to stay ahead of industry trends and maintain a competitive edge.
- Collaborate and Share Insights: Share benchmarking insights with your team and involve them in the decision-making process. Collaborative efforts often lead to more innovative solutions and successful implementations.
- Invest in Training and Development: Equip your team with the necessary skills and knowledge to implement the changes effectively. This might involve training sessions, workshops, or even bringing in external experts to provide guidance.
With these ideas, you can transform the insights gained from benchmarking into actionable strategies that drive tangible results.
Ready to Outperform? Let’s Benchmark Your Digital Marketing
Digital marketing benchmarking is a powerful tool to transform your strategies and achieve measurable success. By comparing key metrics like conversion rates, CTR, and ROI against industry standards and competitors, you can pinpoint where to improve and implement targeted strategies for growth.
Continuous monitoring and adjustment based on benchmarking insights empower you to foster a culture of continuous improvement, ensuring sustained growth and competitive advantage in your industry.
Want to know where your business stands compared to leading brands and competitors in your industry? Send us a message today and we’ll show you where you stand and how you can outperform your competitors.


